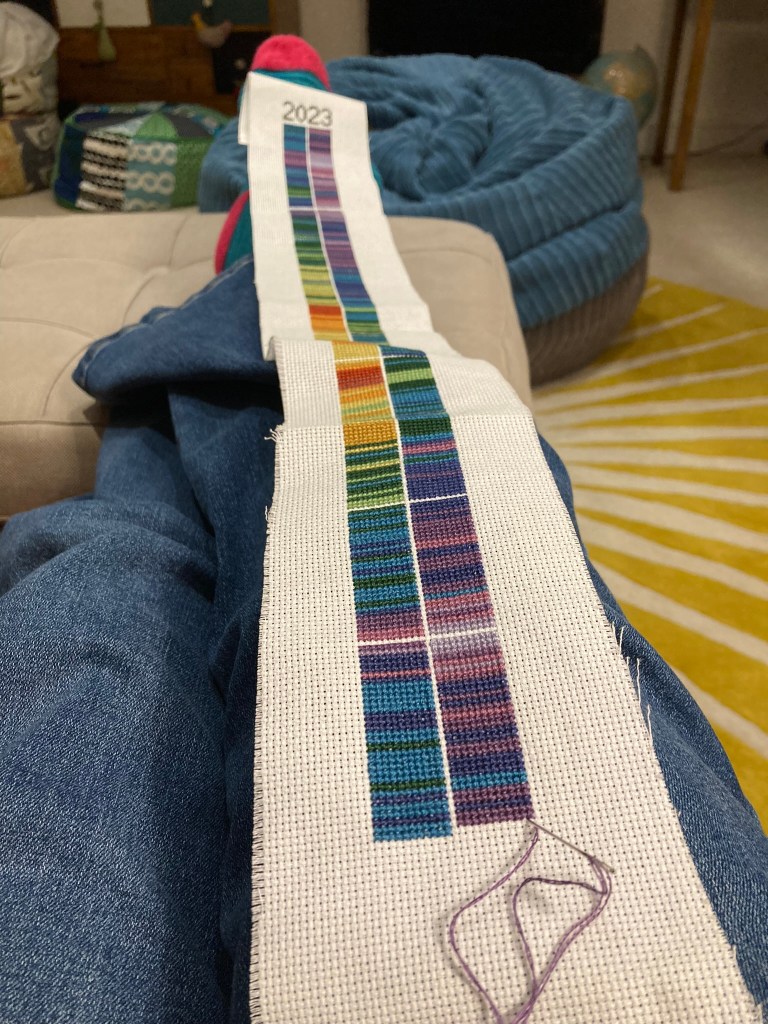
As I was completing my 2022 temperature scarf I started to think about how to continue this project. I found it had made me much more aware of my environment and the changes brought about by climate change and I wanted to be able to see changes and trends across years. I had really enjoyed the discipline of doing something each day, but on the other hand the time taken didn’t leave room for a lot else.
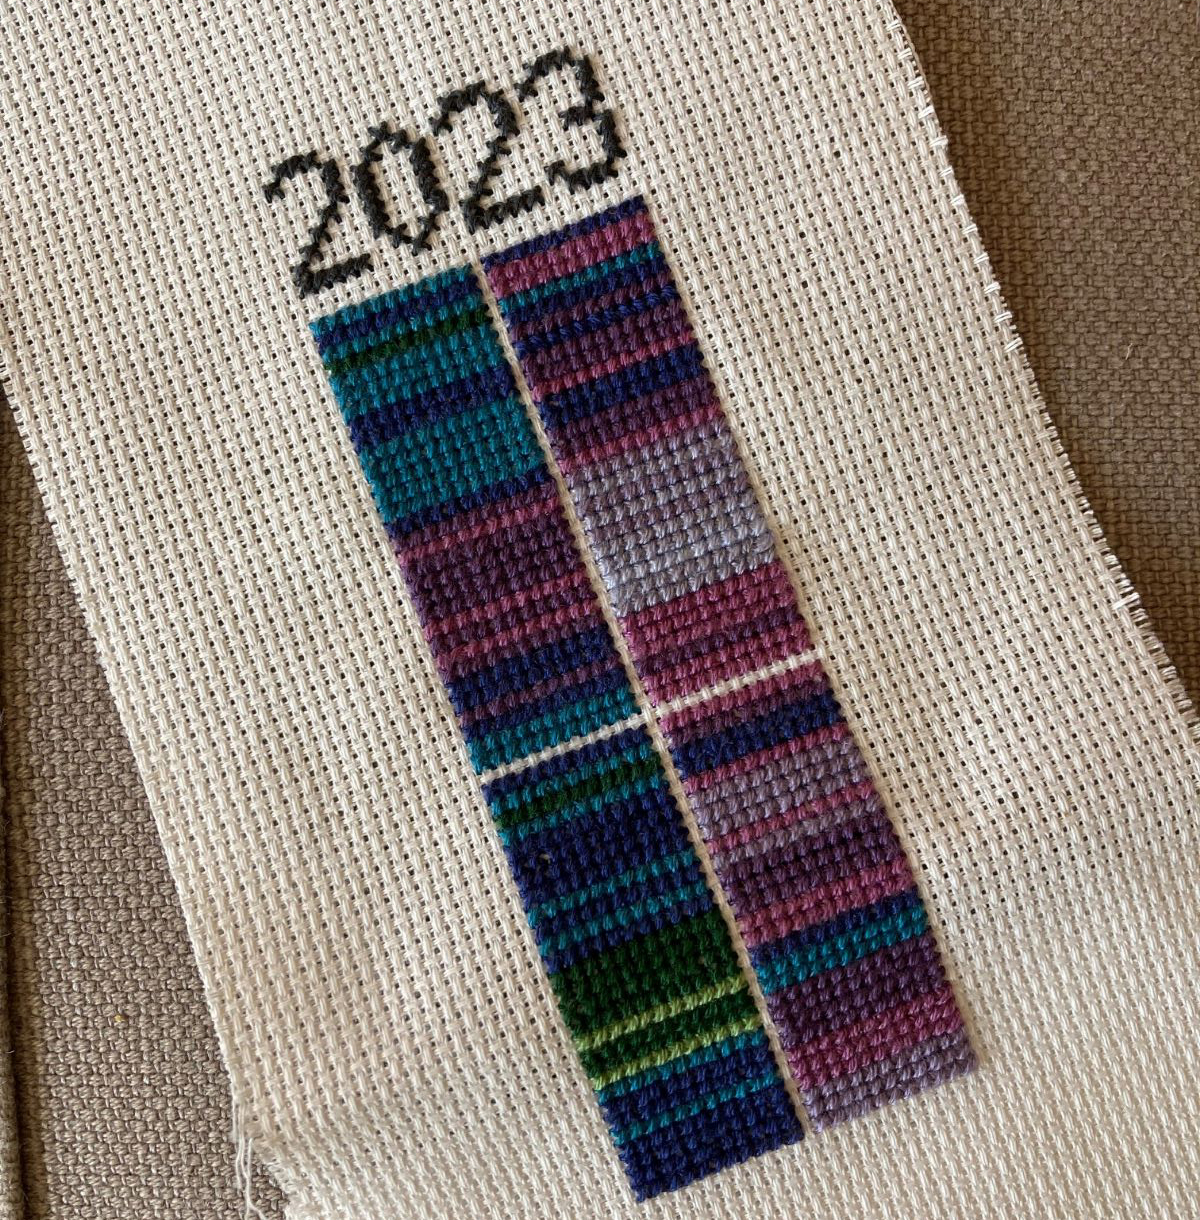
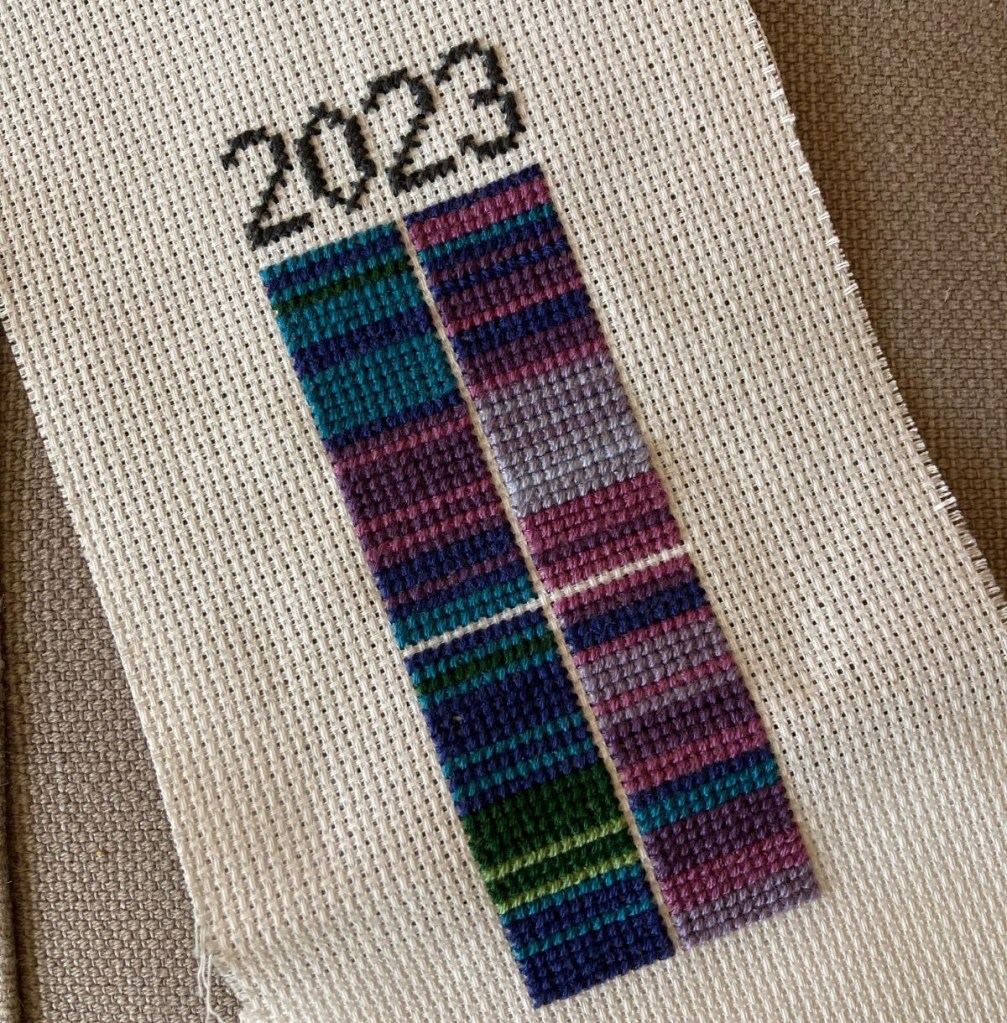
The solution seemed to be quick and simple cross stitch – so quick and simple that as well as the highest temperature of each 24-hour period, I also record the lowest temperature, and it only takes a few minutes a day or a weekly catch-up. I matched embroidery threads to the colours I’d used for my temperature scarf, with each colour representing a three-degree range, and added progressively paler lilacs for the sub-zero temperatures.
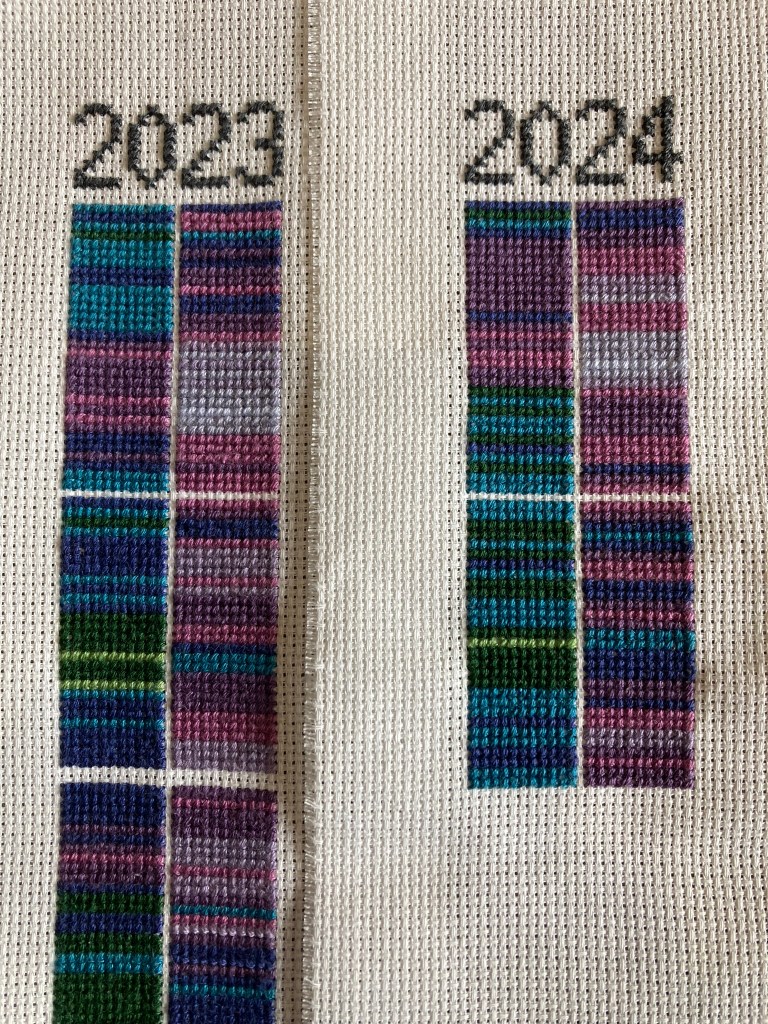
With the first year complete and the second started I can start to compare patterns. I’ve had no need just yet for the colours that represented incredible highs of 2022, and no prolonged cold-snaps either with only a handful of days not getting above zero. January and February were pretty similar for 2023 and 2024. The big question is how long will I continue this for? I guess as long as it continues to hold my interest and to be meaningful in terms of visualising the effects of climate change, and that could be some time!